
CASE/02 / Campaigns & public sector
United States, IndiaWhere an election is decided, booth by booth
Electoral intelligence for a US campaign and an Indian party organisation. Estimates built from official results, mapped from the seat to the street.
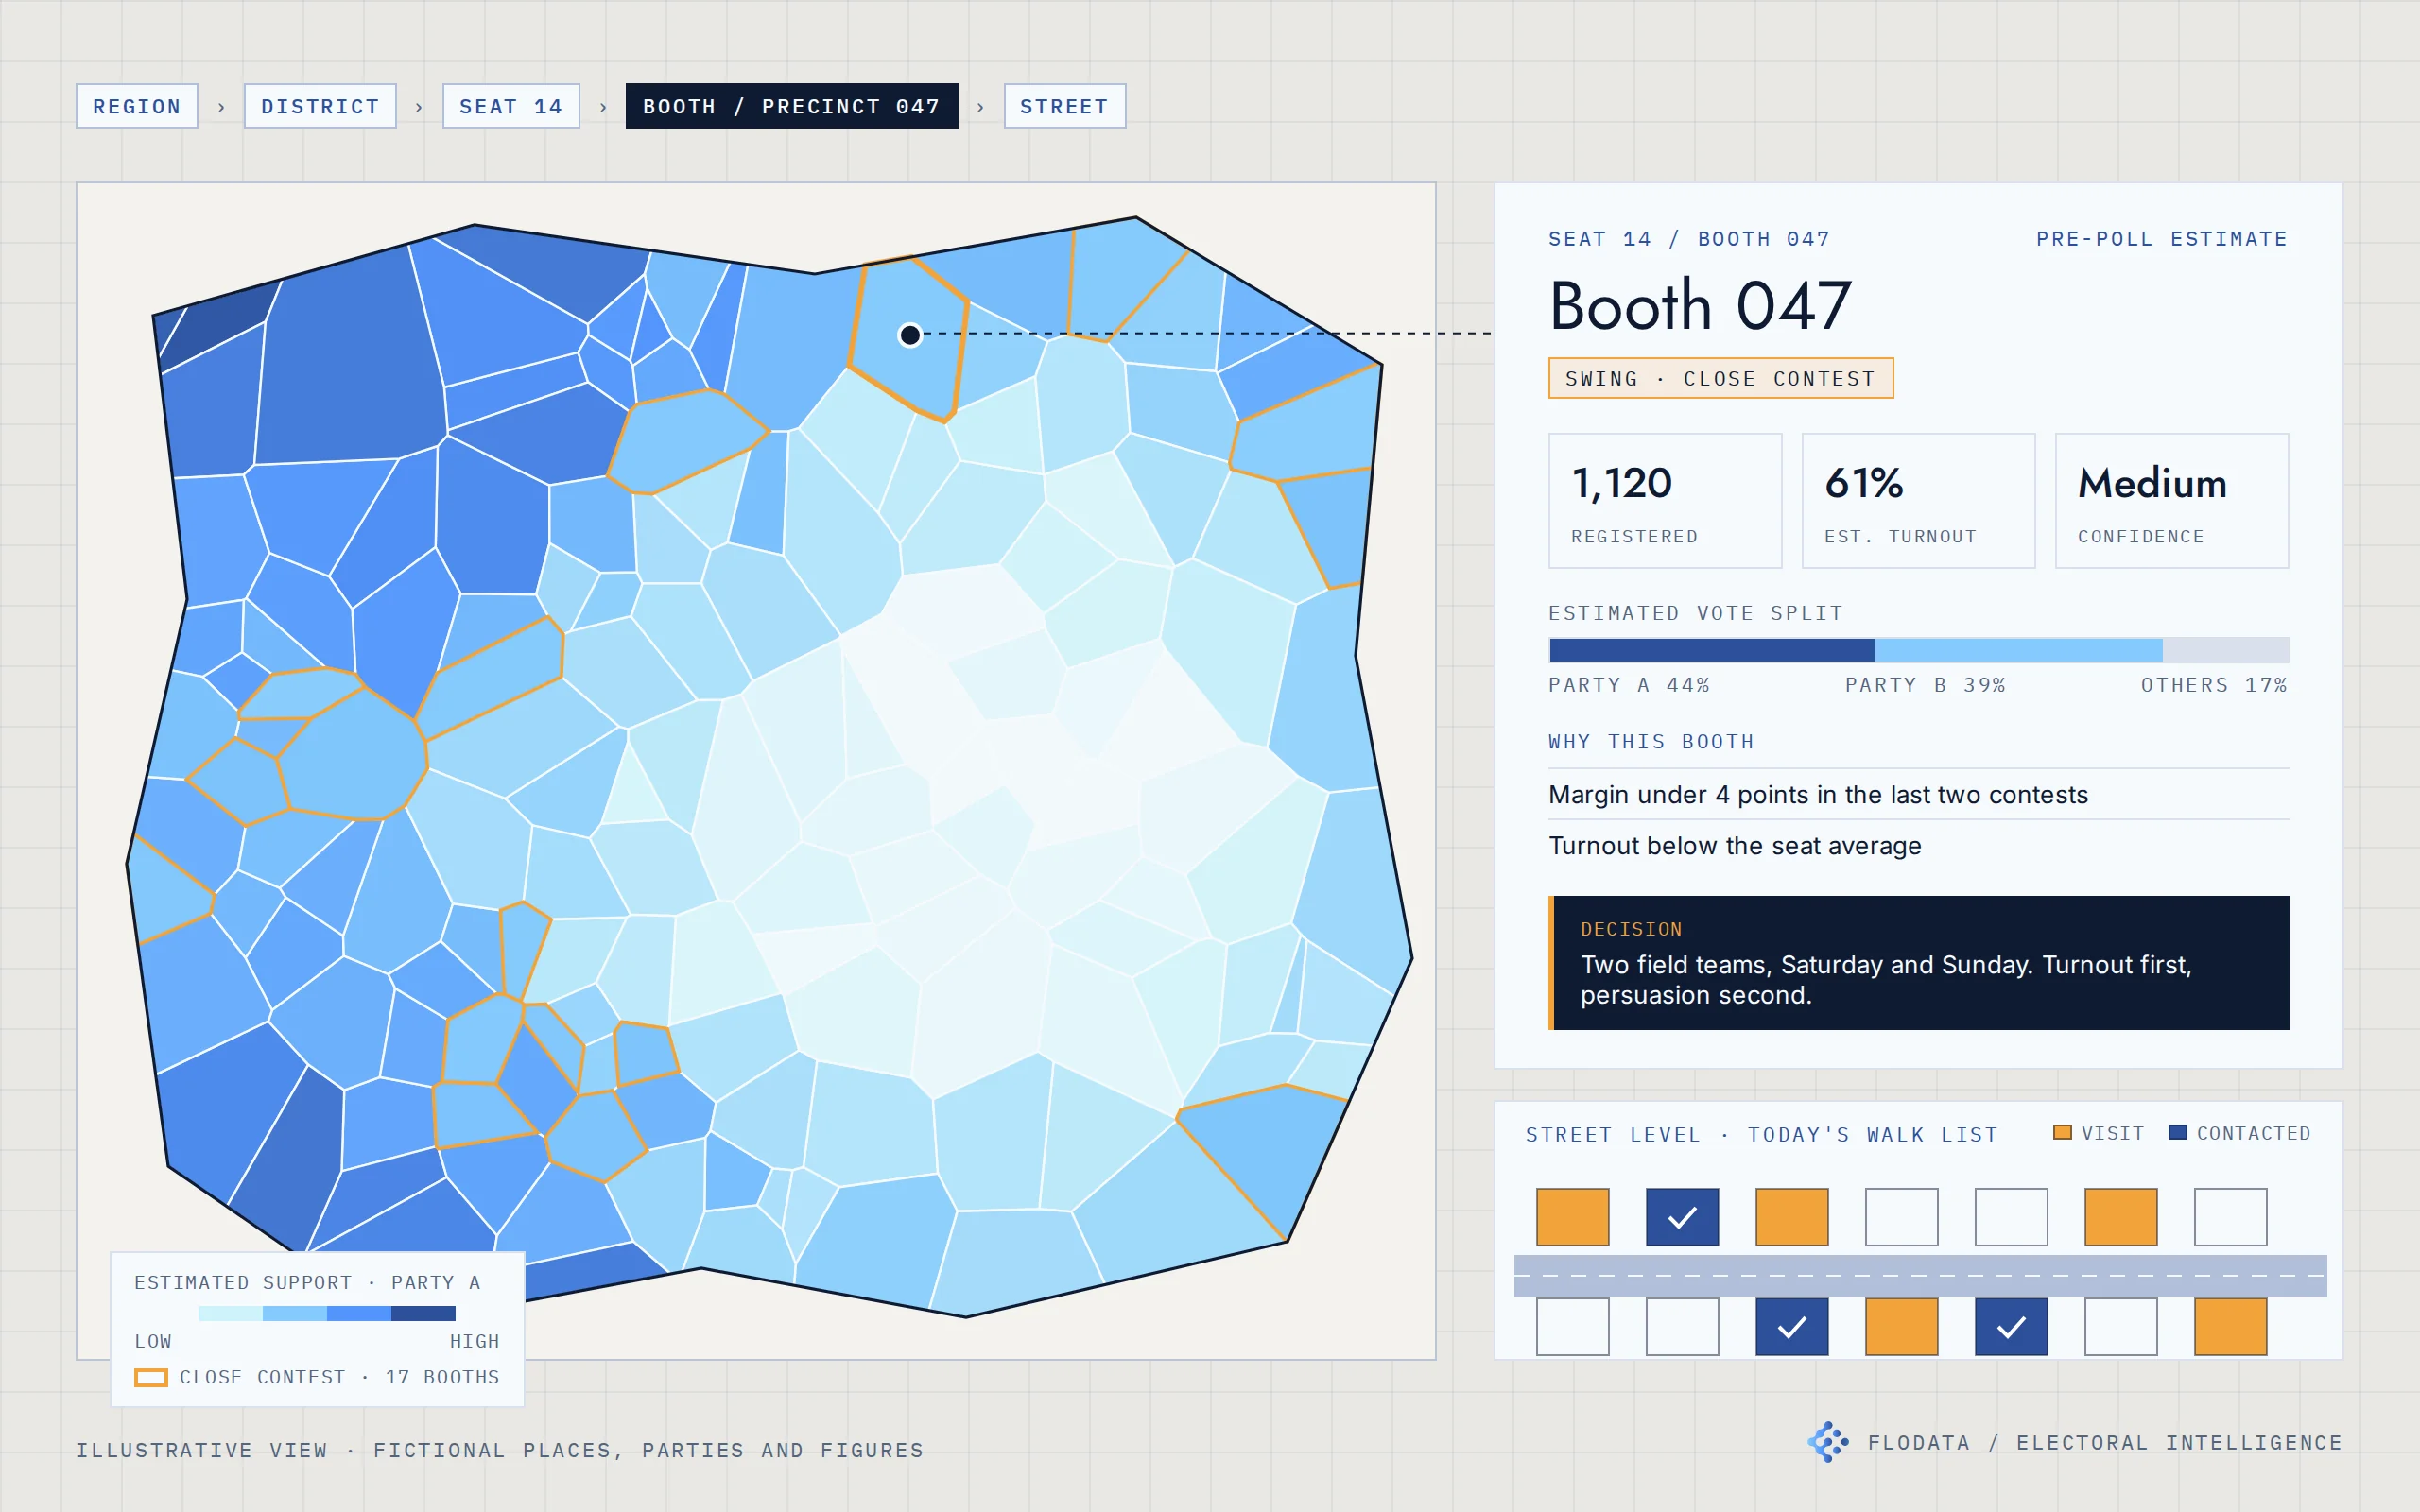
01 / THE ASK
The decision behind the brief.
Two clients, two democracies, one question: where should limited time, money and volunteers go before polling day?
One was a US political campaign in a large swing state. The other was an Indian party organisation working across parliamentary and assembly seats in a large metropolitan region. Both had learned that opinion polls could not answer it. Polls are expensive, rely on small samples and say almost nothing about a single booth or precinct, which is where campaigns actually spend their effort.
02 / WHAT WE FOUND
What the work revealed.
In the US, the data was rich but unread. Public voter records carry registration, turnout history and voting method for every household. The campaign had decades of results across general, state, county and street levels, but no way to read them together. Field, events, volunteers and spending sat in separate tools, so strategy and execution never met.
In India, the data had to be built first. The ballot is secret and results arrive only as booth totals. Electoral rolls do not record who turned out. There is no official map at building level. Booth numbers and boundaries change between elections through delimitation and merging, so historical results do not line up with today's booths without work.
In both, the unit that mattered was the booth. Every useful decision (where to canvass, where to turn out supporters, where to stop spending) was made at booth or precinct level, well below anything a poll can see.
03 / WHAT WE BUILT
Build from the booth up. Put it in the hands of whoever decides.
Rebuild the geography
We digitised official results and electoral rolls from public sources and drew the electorate as a hierarchy of maps: six levels in India, from parliamentary seat to household, and state to county to street in the US. Where booths had been merged or redrawn, we reconciled them so every past election could be compared with the present one. In India this meant building the building and plot layer ourselves.
Describe every booth by who lives there
Each booth is described by its population, grouped into segments from published demographic data. Segments behave differently. They turn out at different rates and support parties in different proportions.
Learn from real results, not surveys
The model learns how each segment behaves from official booth results across many booths and elections. No opinion polls and no interviews. Every estimate is checked against the totals actually recorded at each booth. We do not publish the model design, its inputs or its weighting.
Add up, do not sample down
Segment estimates add up to a booth estimate, booths to a seat, seats to a region. Each booth gets an expected turnout, an expected vote split, a classification (core, leaning, swing or opposed) and a confidence level. So the campaign sees both the estimate and how far to trust it.
One view per decision-maker
Party leadership sees seats: where the contest is genuinely close. Campaign managers see booths ranked by what to do there: turn out, persuade, hold or leave. Candidates and field teams see streets and doors.
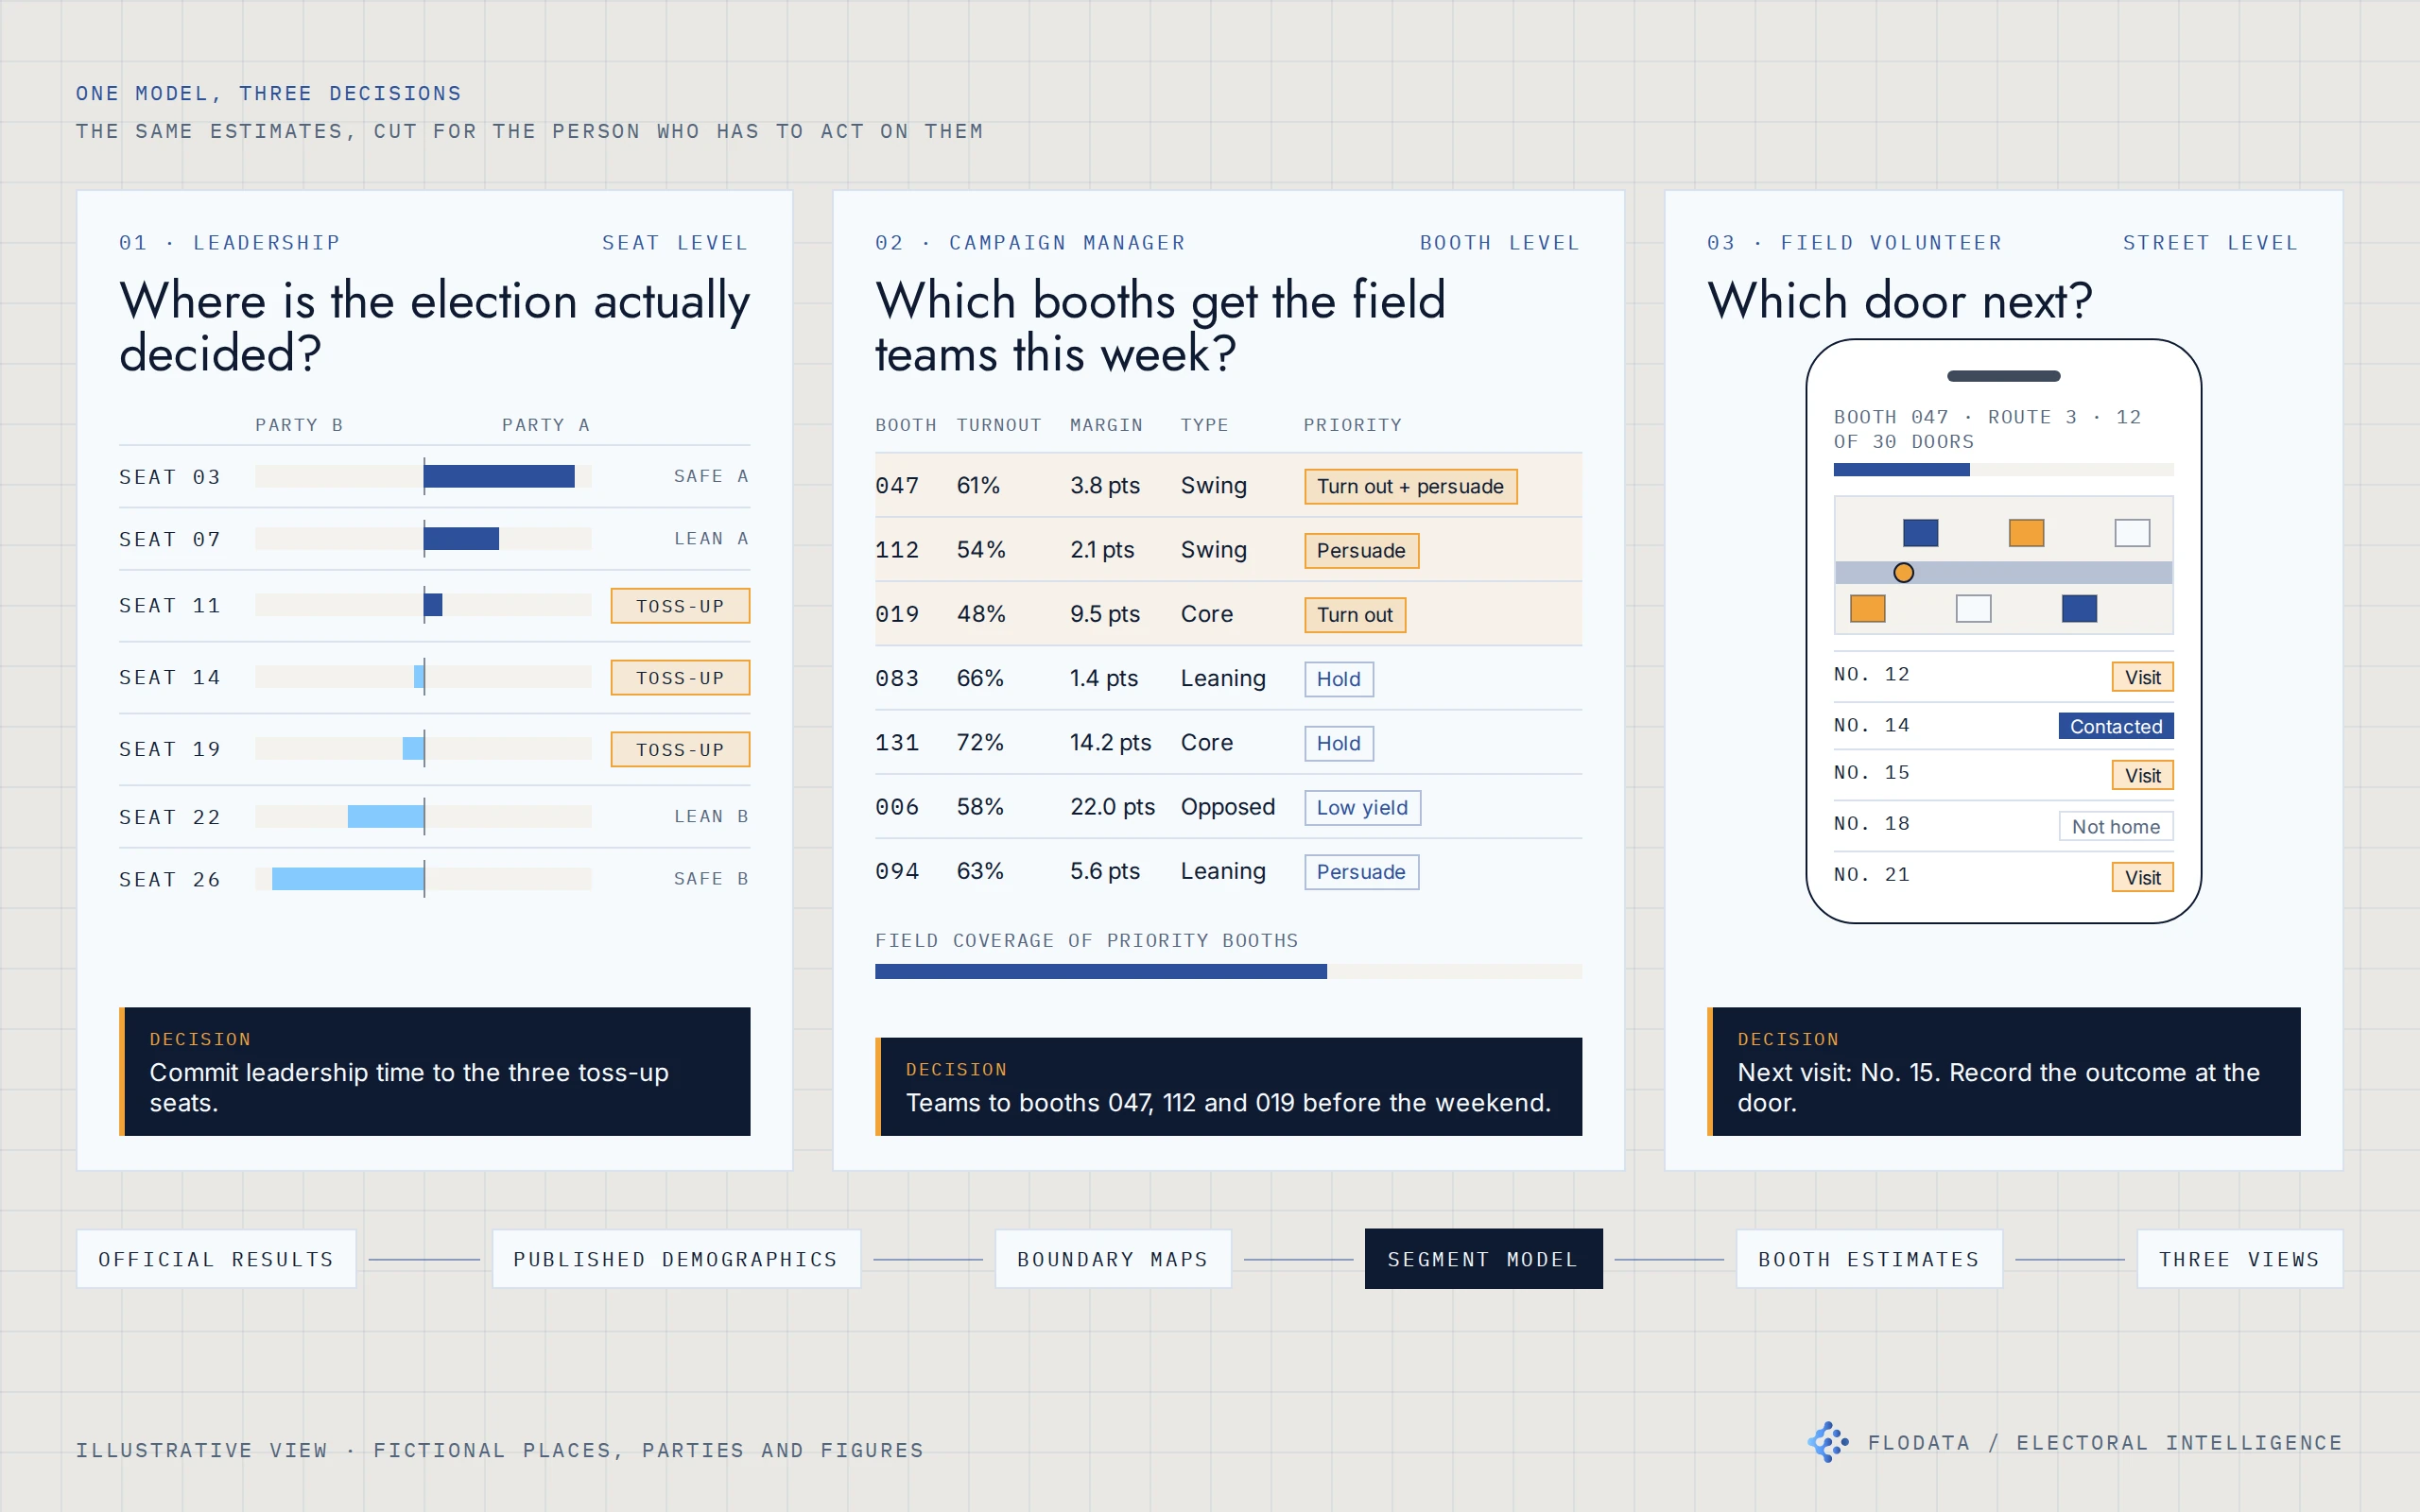
One model, three decisions: the same estimates, cut for the person who has to act on them. Illustrative view with fictional places, parties and figures.
Two deployments, shaped by the ground
The same approach was fitted to very different starting points, as the comparison below shows.
| United States | India | |
|---|---|---|
| Starting point | Rich public voter records, decades of results | Booth totals only, rolls to digitise, no building-level map |
| Geography | State, county, street, household | Parliamentary seat, assembly seat, ward, booth, section, household |
| Hardest problem | Turning history into this week's priorities | Making past booths comparable after boundary changes |
| What the team uses | Web dashboard with administrative and political views, outreach targets, campaign calendar, volunteer oversight, budget tracking and a field app with walk lists | Booth classification, seat and booth dashboards, views for leadership, managers and candidates, bulk estimates exported for the ground team |
04 / THE RESULT
A campaign plan drawn from evidence, down to the street.
Both clients could see, before polling day, which booths were decided, which were close and what kind of effort each close booth needed. Field time went to the booths where it could change the result, and each estimate came with an honest confidence level rather than a single confident number.
05 / ENGINEERING DETAILUnder the hood
- Official results + published demographics + boundary maps
- Segment model
- Booth estimates
- Leadership, manager and field views
Data engineering. Official results and electoral rolls collected from public sources and digitised. Candidate-level counts converted into party-level booth shares. Households grouped from roll entries. Booths reconciled across elections where boundaries or numbering changed.
Spatial layer. Polygons from seat to booth, plot boundaries and geocoded households. The Indian building-level layer was built because no official one exists. Web maps with street, household and boundary layers and drill-down from region to door.
Modelling. Segment-level turnout and preference learned from official booth outcomes. Bottom-up aggregation from segment to booth to seat. Confidence levels on every estimate. Retrained as new results arrive.
Serving. A prediction service for single records, batches, households and booth statistics, with Excel-ready exports. A web dashboard for strategy and a mobile field app for walk lists and door outcomes.
- Official results and electoral rolls from public sources
- Booth reconciliation across elections
- Segment-level turnout and preference model
- Bottom-up aggregation with confidence levels
- Web maps from region to household
- Prediction service with Excel-ready exports
- Web dashboard and mobile field app
A GOOD PLACE TO START